
Cold Weather Altitude Correction
for iPad and Apple Silicon Macs
In aviation, pressure altimeters are used to determine the altitude of an aircraft by measuring the atmospheric pressure. The basic principle is based on the fact that atmospheric pressure decreases with altitude. The altimeter measures the atmospheric pressure and displays it as altitude.
The altimeter is usually calibrated on the basis of the International Standard Atmosphere (ISA), which assumes a certain relationship between altitude, pressure and temperature:
Any deviation from the ISA leads to an error. When temperature is LESS than ISA an aircraft will be LOWER than the altimeter reading.
Colder air than the ISA standard leads to an altitude display that is too high, warmer air than the standard air leads to an altitude display that is too low. If obstacle clearance is not an issue, this is even an advantage, as aircraft with the same altimeter reading will certainly be at the same altitude. In cold temperatures, however, certain barometric values must be corrected:
Note: Baro-VNAV procedures are safeguarded against the effects of low temperature by design in a charted temperature range.
According to ICAO PANS OPS (Doc 8168) "4.3.1 Requirement for temperature correction" the calculated minimum safe altitudes/heights must be adjusted when the ambient temperature on the surface is much lower than that predicted by the standard atmosphere. In such conditions, an approximate correction is 4 per cent height increase for every 10°C below standard temperature as measured at the altimeter setting source. This is safe for all altimeter setting source altitudes for temperatures above –15°C.
For colder temperatures, a more accurate correction should be obtained according to the guidance provided in "4.3.3 Corrections for specific conditions" used by the Cold Weather Altitude Correction app.
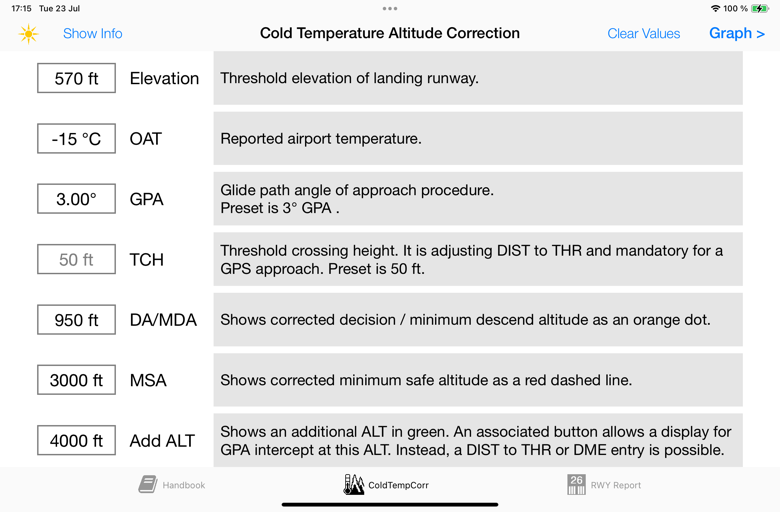
Summary
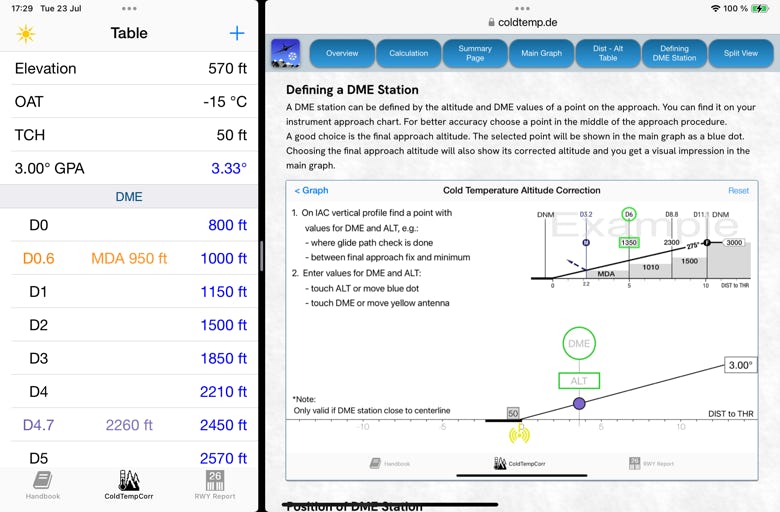
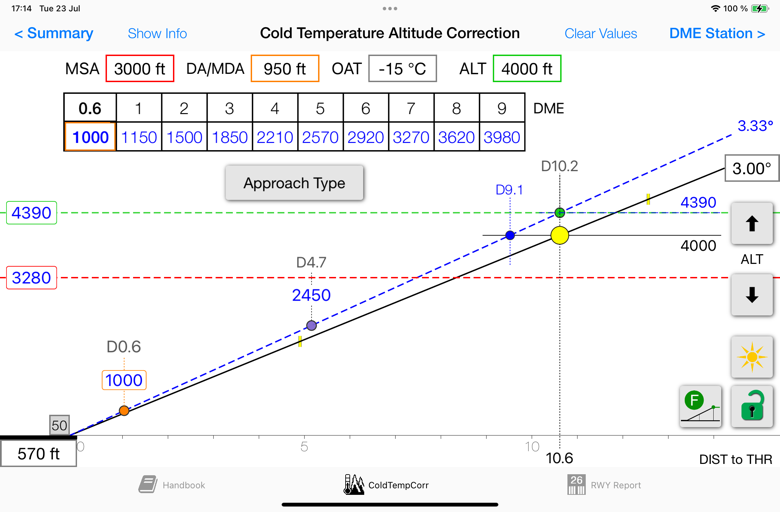
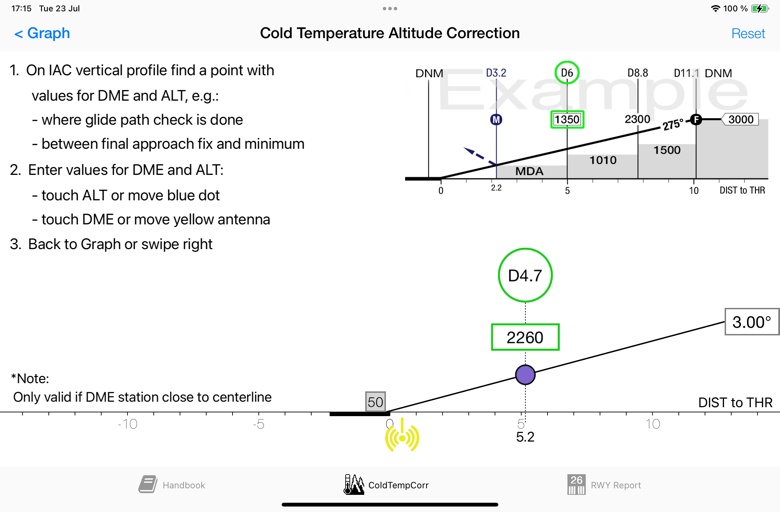
Main Graph
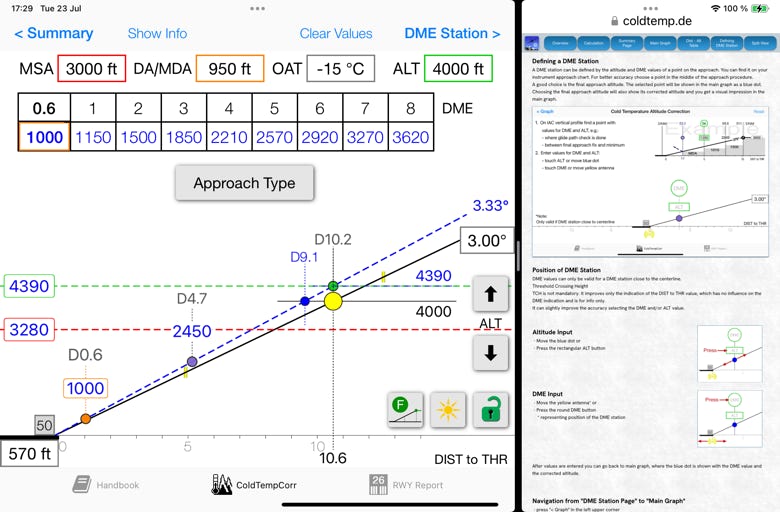
DME Station
Split View is supported. The design of the main view changes with the available view. If the view becomes too small, the corrected values are displayed in a conventional table, e.g. next to an approach chart.
Wide
Small